Give Life to Your Knack Dashboards as Never Before!

Hey folks, Have you seen those race charts where bars moves through the timeline? That's achievable using Flourish!
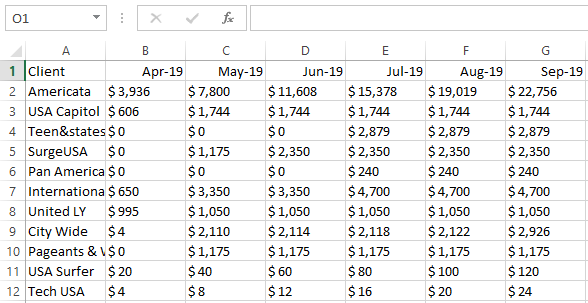
To make it work in your app, all you need to do is export your Knack records in a CSV. Bear in mind that Flourish likes that the Dates field are organized by columns, For example, if your timeline will display data across the years, your CSV will need to have a column per each year like this:
CSV extracted from Knack
Using Flourish you can import the dataset and select and configure the labels, values, and categories...
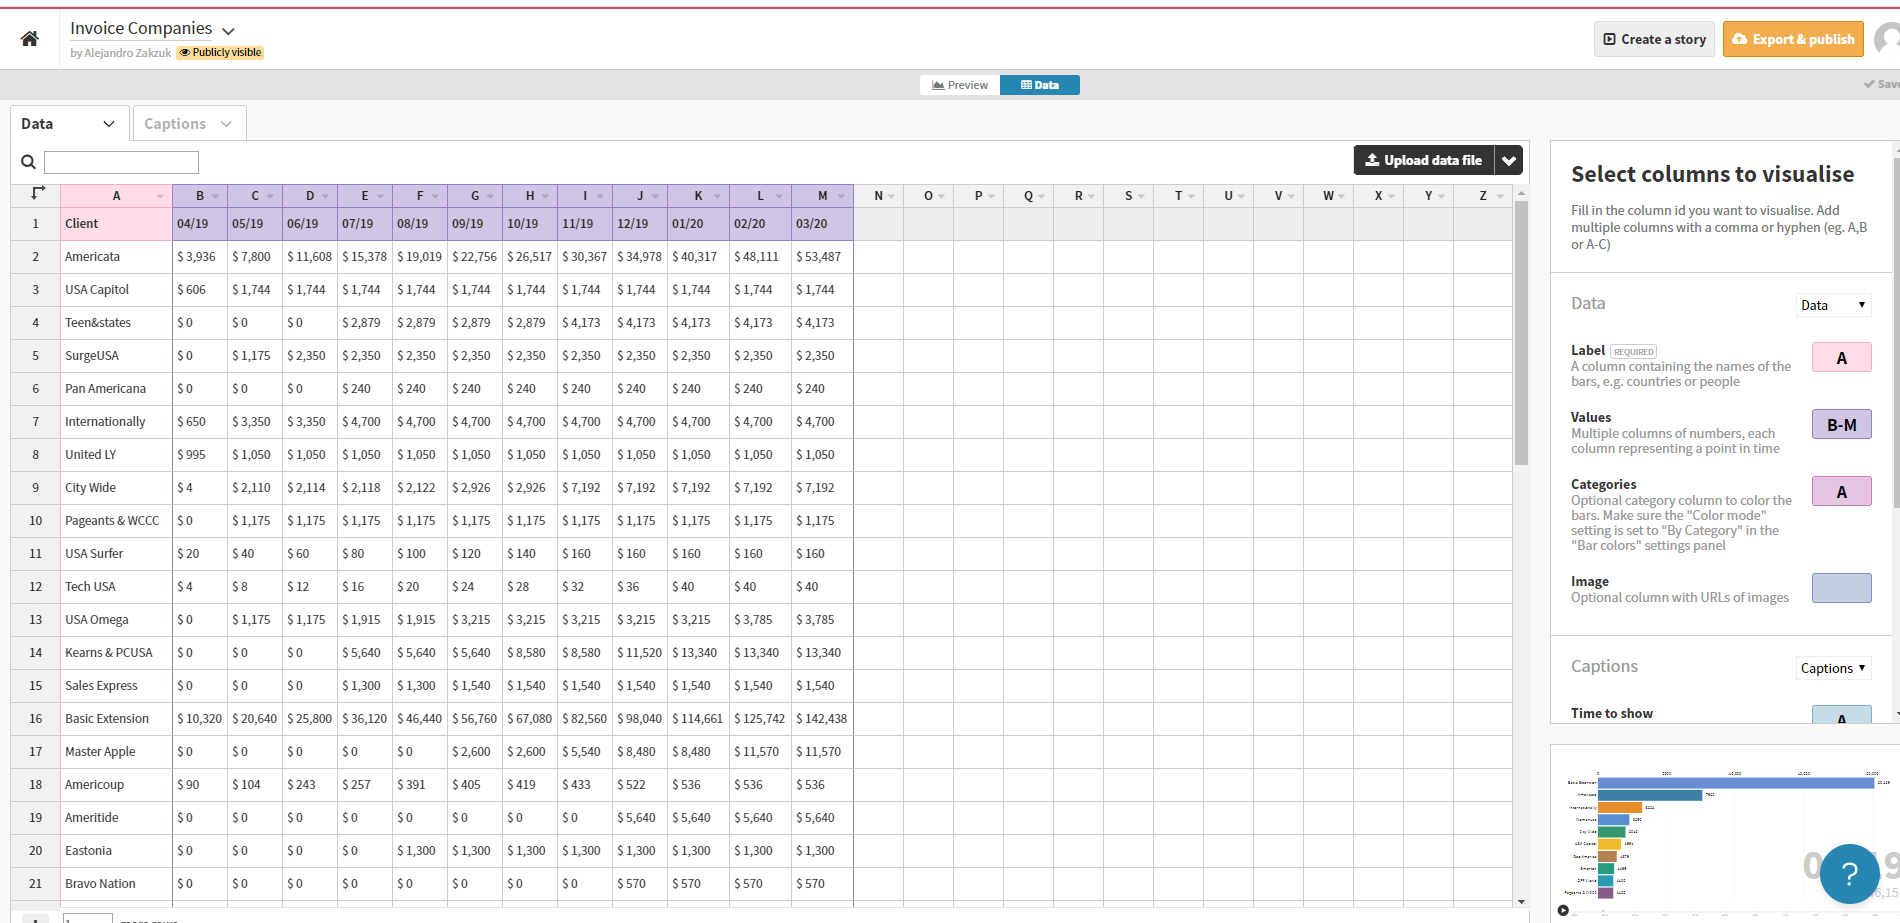
Data set options
And convert it into an interactive table like this…
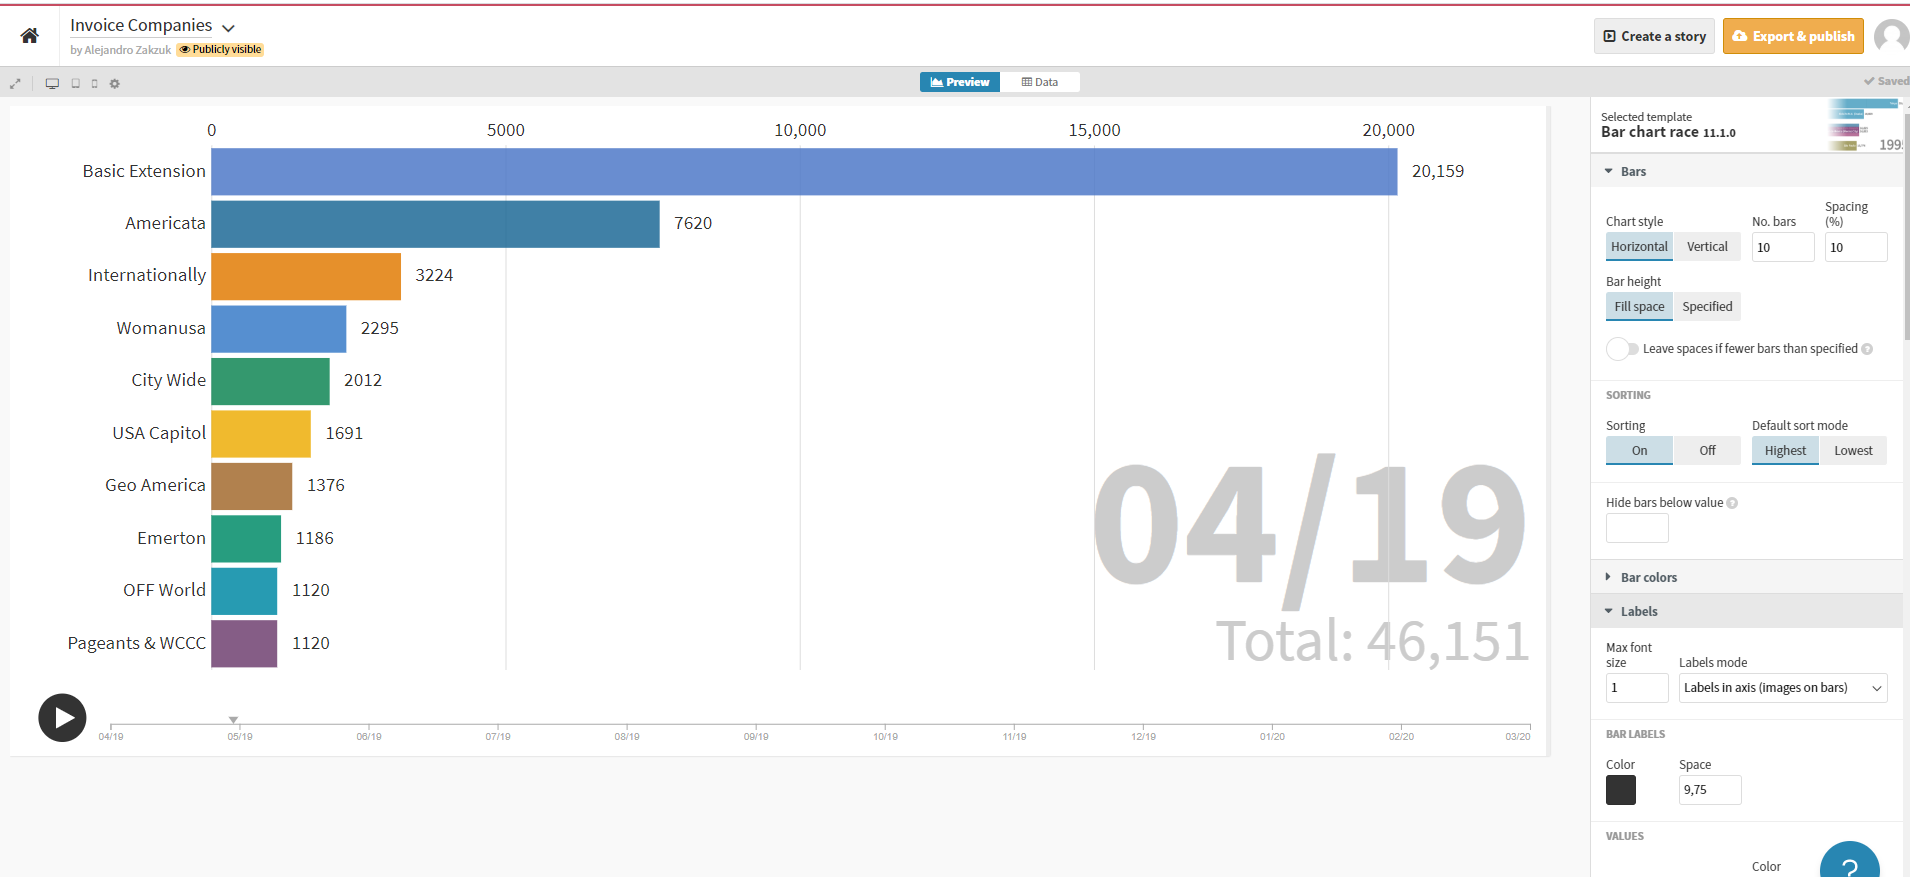
Interactive race chart
Take at look how it works when it's embedded in Knack
https://soluntech.knack.com/test#flourish-sample/
If you liked this, please leave a comment below!
We love to Make IT Happen!
Soluntech Team
AI-Native Engineering Firm
Soluntech's team writes about software, AI systems, validation, and operational technology from the perspective of disciplined engineering and long-term system ownership.
Continue with related insights.
Explore more thinking connected to this topic, from software decisions to AI systems and operational execution.

Decision Intelligence: Enhancing Business Strategy with AI
Decision Intelligence: Enhancing Business Strategy with AI
Soluntech Team
AI-Native Engineering Firm
Conquer the Challenge of Product-Market Fit as a Founder
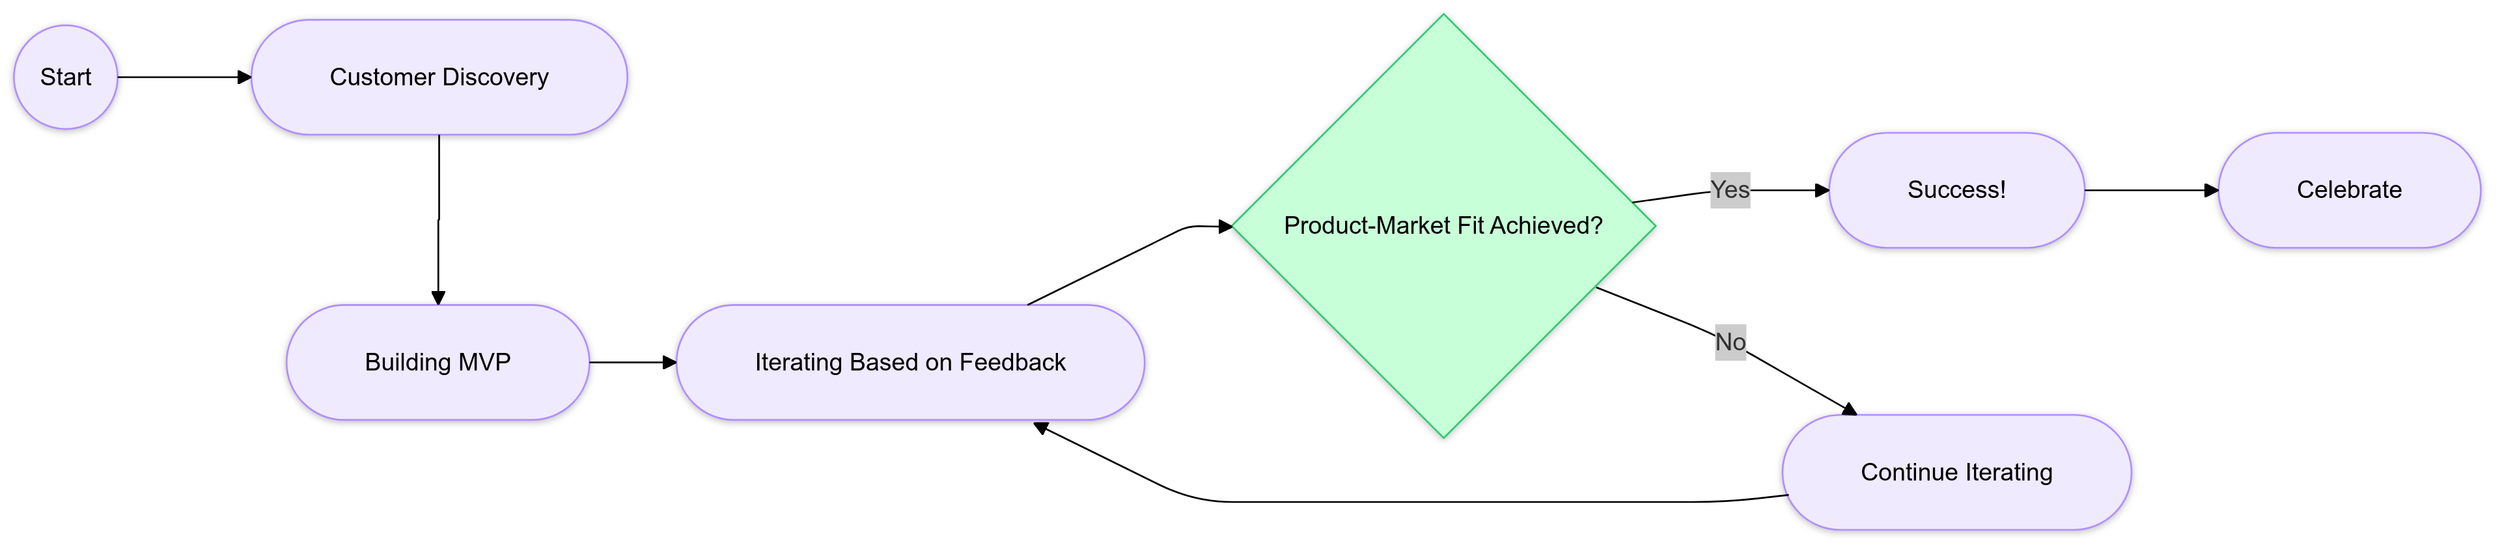
Product Market Fit Flow Chart
Soluntech Team
AI-Native Engineering Firm

The Metaverse: It Doesn’t Exist Yet, but Companies Are Already Doing Business in It
Photo by Michelangelo Buonarroti from Pexels
Soluntech Team
AI-Native Engineering Firm