Make smart decision with business intelligence charts

4 ways you could do that:
1. Knack Charts: It's simple, it's quick. The downside is that it's limited to a single object in Knack; so, as long a you've built an object, you can make the most out of Knack charts.
2. A third-party chart library: They are great as they offer options such as geo charts, heat charts, and much more. Most common free libraries are ChartJS, and Google Charts, and paid library DHTMLX. They integrate easily with Knack using JavaScript.
3. Custom made charts: There are times where it makes sense to build your charts in such a way. Using JavaScript you can build a chart with the connections, and calculations as you need them to be.
4. Business intelligence tools: There are some smart software tools out there (ie Tableau, Qlik) that, with some integration work with Knack, could display some pretty interesting charts including prediction charts (AI), and trend charts.
Soluntech Team
AI-Native Engineering Firm
Soluntech's team writes about software, AI systems, validation, and operational technology from the perspective of disciplined engineering and long-term system ownership.
Continue with related insights.
Explore more thinking connected to this topic, from software decisions to AI systems and operational execution.

Decision Intelligence: Enhancing Business Strategy with AI
Decision Intelligence: Enhancing Business Strategy with AI
Soluntech Team
AI-Native Engineering Firm
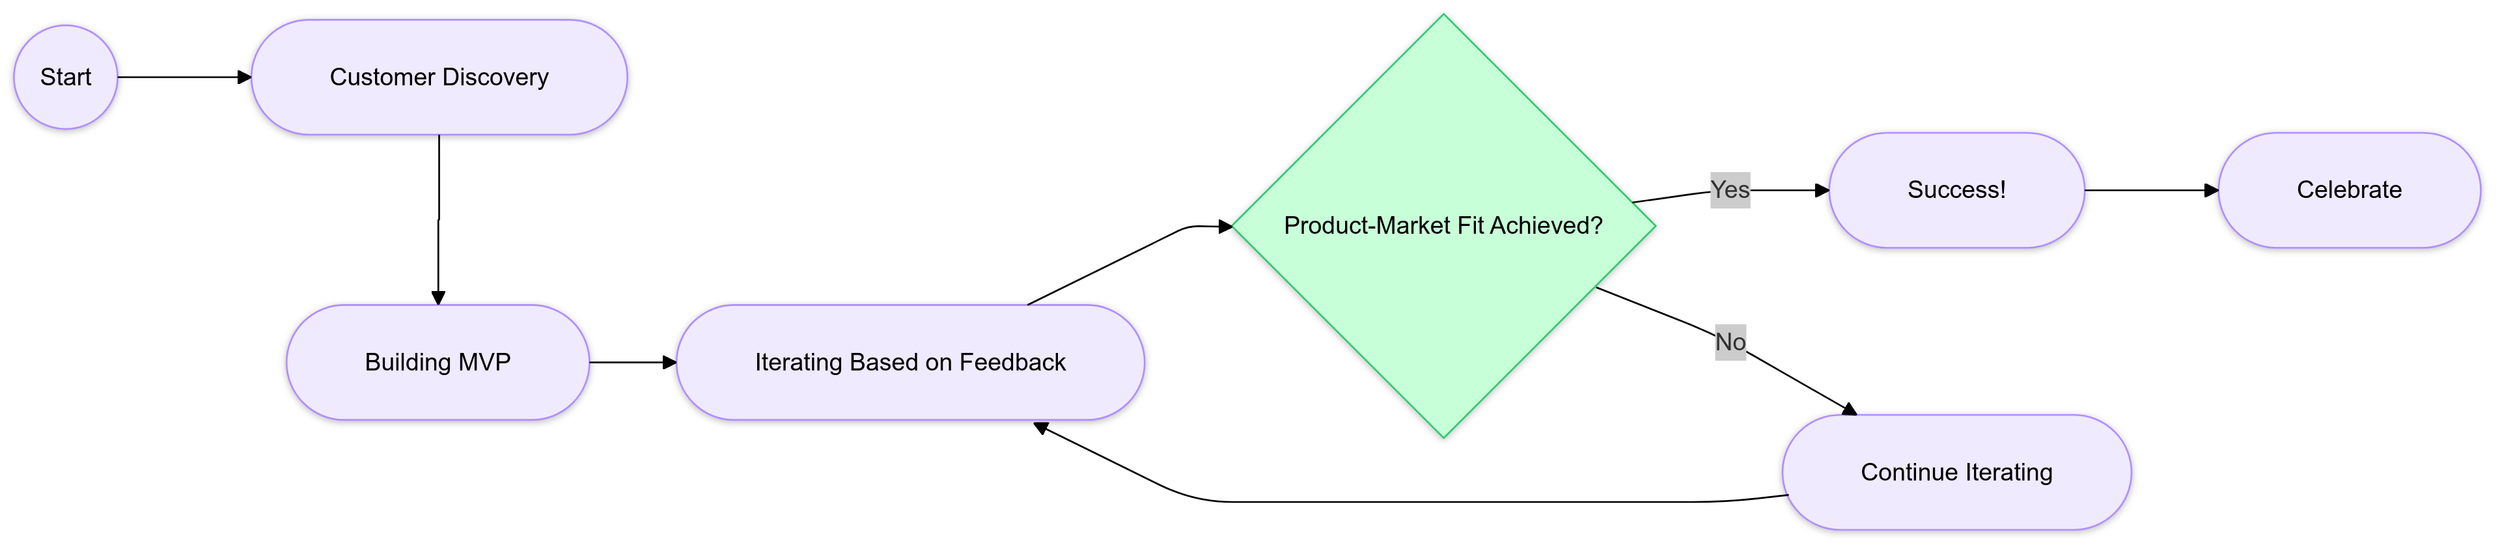
Conquer the Challenge of Product-Market Fit as a Founder
Product Market Fit Flow Chart
Soluntech Team
AI-Native Engineering Firm

The Metaverse: It Doesn’t Exist Yet, but Companies Are Already Doing Business in It
Photo by Michelangelo Buonarroti from Pexels
Soluntech Team
AI-Native Engineering Firm